The official django tutorial is very good, it stops short of displaying
data with matplotlib - which could be very handy for dsp or automated
testing. This is an extension to the tutorial. So first you must do the
official tutorial!
Complete the tutorial (as of writing this up to part 4).
Adding an image to a view
To start with we will take a static image from the hard drive and
display it on the polls index page.
Usually if it really is a static image this would be managed by the
webserver eg apache. For introduction purposes we will get django to
serve the static image. To do this we first need to change the
template.
At the moment poll_list.html probably looks something like this:
Change it by adding the line anywhere outside of the special "{% template tags %}"
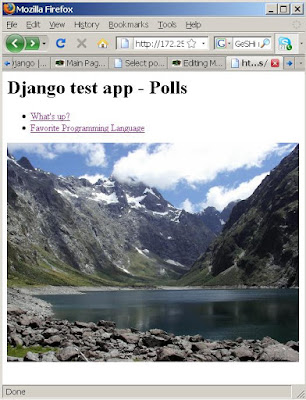
Now if you reload your page - you should see a placeholder
image, or nothing. If you view the source in your browser you should
see the extra line we added. If we try to view just the image, eg going
to [1] we should see a django 404 (page not found error).
Now we must add a line in the urls.py file to link the image with a view:
It should end up looking something like the following:
This means we have to make a view called showStaticImage.
Add a function to the views.py file as follows - replace the path with your own

This point it is worth noting we have imported PIL the python image library - it is not always included by default.
Now if you try reload your poll index page - you should see whatever image you choose.
Thats all well and good but we want to plot data, dynamically generated based on changing data.
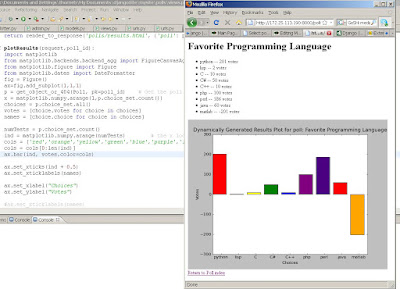
Keeping going with the polls app - lets plot the results automatically - so the results page shows a graph.
I may have fabricated these votes :-P

Hmm, sorry for the formating of this post - I'll try get back to it if I can find the original wiki page I made while at Tait.
testing. This is an extension to the tutorial. So first you must do the
official tutorial!
Complete the tutorial (as of writing this up to part 4).
Adding an image to a view
To start with we will take a static image from the hard drive and
display it on the polls index page.
Usually if it really is a static image this would be managed by the
webserver eg apache. For introduction purposes we will get django to
serve the static image. To do this we first need to change the
template.
Change the template
At the moment poll_list.html probably looks something like this:
<h1>Django test app - Polls</h1>
{% if object_list %}

<ul>
{% for object in object_list %}
<li><a href="/polls/{{object.id}}">{{ object.question }}</a></li>

{% endfor %}
</ul>
{% else %}

<p>No polls are available.</p>
{% endif %}
Change it by adding the line anywhere outside of the special "{% template tags %}"
<img src="/polls/staticImage.png" width="500px">
Now if you reload your page - you should see a placeholder
image, or nothing. If you view the source in your browser you should
see the extra line we added. If we try to view just the image, eg going
to [1] we should see a django 404 (page not found error).
Add the url for the static image into the url handler
Now we must add a line in the urls.py file to link the image with a view:
It should end up looking something like the following:
from django.conf.urls.defaults import *
from mysite.polls.models import Poll


info_dict = {
'queryset': Poll.objects.all()
}

urlpatterns = patterns('',
(r'^$', 'django.views.generic.list_detail.object_list',info_dict),
(r'^(?P<object_id>\d+)/$', 'django.views.generic.list_detail.object_detail',info_dict),
url(r'^(?P<object_id>\d+)/results/$', 'django.views.generic.list_detail.object_detail',dict(info_dict,template_name="polls/results.html"),'poll_results'),
(r'^(?P<poll_id>\d+)/vote/$', 'mysite.polls.views.vote'),
(r'^staticImage.png$', 'mysite.polls.views.showStaticImage'),

)
This means we have to make a view called showStaticImage.
Add the view for the static image
Add a function to the views.py file as follows - replace the path with your own
def showStaticImage(request):
""" Simply return a static image as a png """

imagePath = "C:/Documents and Settings/thorneb/My Documents/Fiordland_Lake_Marian.png"
from PIL import Image
Image.init()
i = Image.open(imagePath)

response = HttpResponse(mimetype='image/png')
i.save(response,'PNG')
return response

This point it is worth noting we have imported PIL the python image library - it is not always included by default.
Now if you try reload your poll index page - you should see whatever image you choose.
Adding a dynamic image
Thats all well and good but we want to plot data, dynamically generated based on changing data.
Keeping going with the polls app - lets plot the results automatically - so the results page shows a graph.
- Add an image tag somewhere in the results template:
<img src="result.png">
- Add another url clause:
(r'^(?P<poll_id>\d+)/results/result.png$', 'mysite.polls.views.plotResults')
- Add another new view:
def plotResults(request,poll_id):
import matplotlib
from matplotlib.backends.backend_agg import FigureCanvasAgg as FigureCanvas
from matplotlib.figure import Figure
from matplotlib.dates import DateFormatter
fig = Figure()

ax=fig.add_subplot(1,1,1)
p = get_object_or_404(Poll, pk=poll_id) # Get the poll object from django

x = matplotlib.numpy.arange(1,p.choice_set.count())
choices = p.choice_set.all()

votes = [choice.votes for choice in choices]
names = [choice.choice for choice in choices]


numTests = p.choice_set.count()
ind = matplotlib.numpy.arange(numTests) # the x locations for the groups

cols = ['red','orange','yellow','green','blue','purple','indigo']*10

cols = cols[0:len(ind)]
ax.bar(ind, votes,color=cols)


ax.set_xticks(ind + 0.5)
ax.set_xticklabels(names)


ax.set_xlabel("Choices")
ax.set_ylabel("Votes")

#ax.set_xticklabels(names)

title = u"Dynamically Generated Results Plot for poll: %s" % p.question
ax.set_title(title)


#ax.grid(True)
canvas = FigureCanvas(fig)
response = HttpResponse(content_type='image/png')

canvas.print_png(response)
return response
I may have fabricated these votes :-P

Hmm, sorry for the formating of this post - I'll try get back to it if I can find the original wiki page I made while at Tait.